Modelling the beneficial influence of trees on PM2.5 air pollution concentrations and population exposure, within Portsmouth
As part of the UKCEH City Explorer Toolkit team’s knowledge exchange with Portsmouth City Council funded by the RECLAIM Network Plus, David Fletcher from UKCEH carried out some initial modelling to quantify the particulate air pollution removal contribution made by trees.
PM2.5 is the most damaging component of urban air pollution, with elevated PM2.5 concentrations associated with negative health impacts such as lung cancer, pulmonary inflammation, altered cardiac function, and acute stroke mortality. Current estimates suggest around 238,000 premature deaths annually in the EU, where approx. 95% of monitoring stations exceed the 5 μg/m3 World Health Organisation (WHO) 2021 guideline.
Vegetation, trees in particular, capture air pollution particles and remove them from the atmosphere. The following equation calculates the change in PM2.5 concentration that occurs as a result of pollution removal through these “dry deposition” processes and is a function of the proportion of woodland in an area, the initial concentration of PM2.5, and an interaction term between those two factors.
Change_PM_conc = - 0.0318 * PM_conc - 0.1112 * Log10WoodPC - 0.054 *
PMxLogWood + 0.0832
Where Change_PM_conc is the change in PM2.5 concentration (µg m-3), PM_conc is the initial PM2.5 concentration (µg m-3), Log10WoodPC is the Log10 of the percentage of woodland (percentage +1%, to avoid very low values) in the relevant area, and PMxLogWood is PM_conc multiplied by Log10WoodPC.
Since a realistic change in pollutant concentration can only be achieved with vegetation over a large area, this equation is designed to be used at a 1 km2 scale using average PM2.5 concentrations and overall proportions of woodland. The whole process is carried out using a kernel (moving window) approach, corresponding with 1 km2.
The aim of this analysis was to quantify the reduction in PM2.5 due to woodland, and to quantify population exposure (both with and without trees), with reference to the WHO PM2.5 guideline. The analysis was based on 2023 PM2.5 annual average 1km gridded data, from DEFRA (https://uk-air.defra.gov.uk/data/pcm-data), WorldPop (https://hub.worldpop.org/) population data (100 m, 2020 constrained, UN adjusted), and our custom 10 m land cover dataset, based on WorldCover (https://esa-worldcover.org/en).


The modelling shows that the woodland in Portsmouth has a substantial impact on PM2.5, with just under 5700 kg removal, annually. Across the whole administrative area, maximum and mean PM2.5 concentrations are around 7% lower than they would be without trees, with minimum concentration around 3% lower.
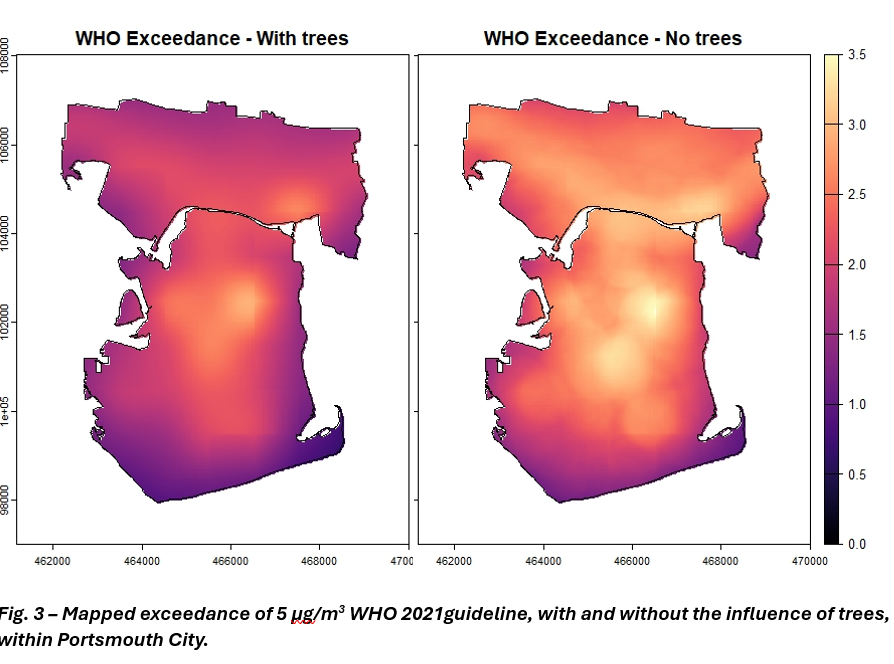
In terms of population exposure, 222,566 people in Portsmouth are exposed to PM2.5 concentrations exceeding the 5 μg/m3 WHO 2021 guideline, to some degree, regardless of presence or absence of trees. However, the degree of exceedance to which they are exposed is moderated by the impact of trees, with the largest shift seen in the group of people exposed to concentrations exceeding the guideline by 2-3 μg/m3 (see Table 1). Areas of the city that would exceed the guideline by the greatest degree, in the absence of trees (see Fig. 3), are the centre, and the northern mainland region adjacent to the large busy roads (M27 & A27).
Future modelling work will focus on modelling numerous tree planting and removal (e.g. loss of trees through disease) scenarios, and will quantify air pollution removal and atmospheric cooling at Lower Super Output Area scale.
Table 1 – Population exposed to exceedance of WHO 5 µg m-3 limit.
Exceedance (µg m-3) With Trees Without Trees
>0 222,56 222,566
>1 220,975 222,562
>2 110,267 183,908
>3 - 20,512
>4 - -
This Knowledge Exchange Visit by David Fletcher (UKCEH) with Portsmouth City Council has been supported by the UKRI-funded RECLAIM Network Plus grant (EP/W034034/1).